Separating the signal from the noise
Signal processing and feature extraction techniques for biological data
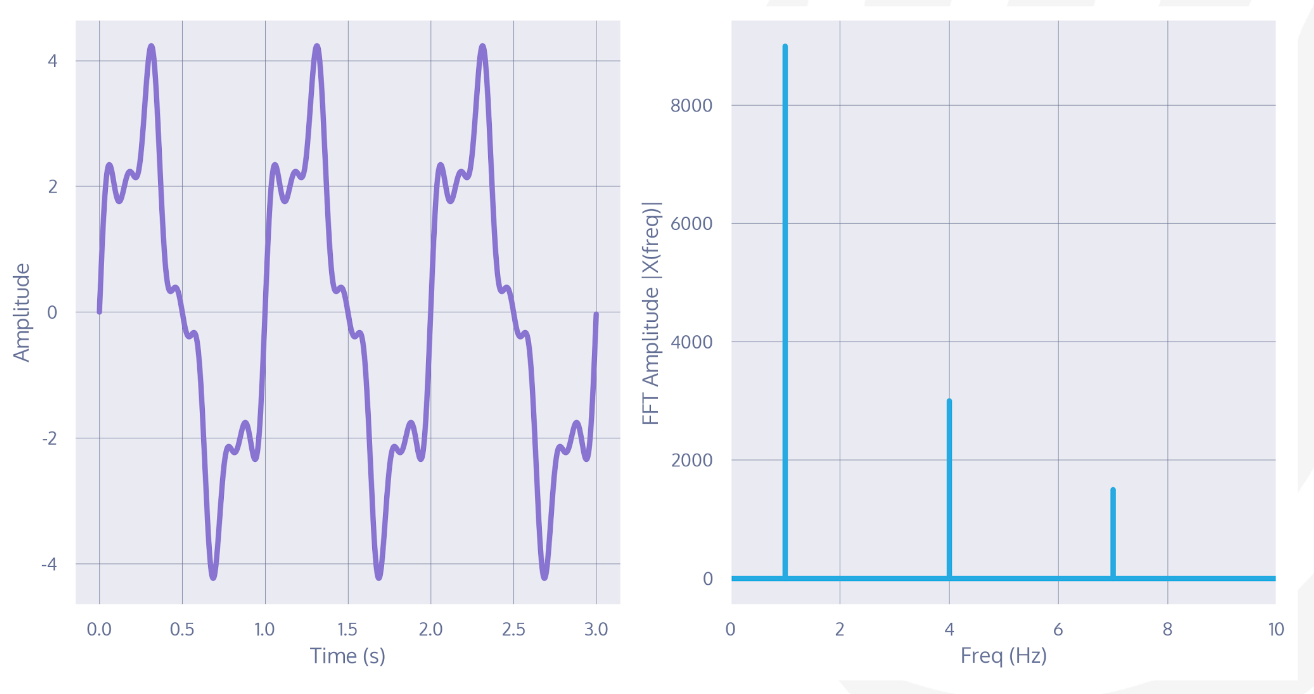 Left: A signal containing 3 different frequency components (left). Right: A Fast Fourier Transform of the data clearly identifies the 3 frequencies making up the signal.
Introduction
Your model is only as good as the data that goes into it, so removing the maximum amount of noise while retaining signal is vital.
This workshop focused on end-to-end signal processing of biological data, using real-life photoplethysmography (PPG) data as an example.
The talk and notebook introduces basic time and frequency domain signal processing techniques and methods to identify and deal with motion artefacts. You’ll learn when to apply which techniques and how to evaluate the outcome.
Learning Outcomes
At the end of the workshop attendees should be able to:
- list 2 use cases for signal processing
- create spectrograms to visualize data
- differentiate between frequency and time-domain analysis
- know when to use frequency and when to use time-domain filters
- apply at least one frequency and one time-domain filter to the data
- evaluate whether the filter was successful
- discuss 2-3 factors to consider in data collection of PPG signals
Data and Notebook
The data comes from the PPG-DaLiA archive . PPG-DaLiA contains data from 15 subjects wearing physiological and motion sensors, providing a PPG dataset for motion compensation and heart rate estimation in Daily Life Activities.
This colab notebook takes you through the workshop materials.
Link to the repo containing the notebook and slides.